
In this article I will show you 2 different methods to create a dynamic date dimension table in Power BI. Since you are reading this, I assume that you are a Power BI user and familiar with the concept of star modeling. If this is not the case, I refer you to this other article that explain this concept.
Why a dynamic date table?
Date is the dimension most commonly found in a star data model. Indeed, when you want to analyze a fact according to a temporal axis, you must refer to a date. If for example you want to cross 2 different facts, for example sales and returns, you have no choice but to go through a date dimension which will be attached to the 2 fact tables. When talking about conforming dimensions (consult this article if you are not familiar with conformed dimensions), the date dimension comes at the top of the list since it is often shared by multiple fact tables in a star data model. In short, it is important to properly define the date table in your data model since it is one of the most frequent tables and must evolve over time to take into account the new days that are added.
Now that I’ve convinced you (I know, I know, I didn’t need to convince you 😉) to use a date dimension in your data model, let’s get to the topic of the article, either creating a table of dynamic date in Power BI. There are 2 methods to achieve our ends, either to create the table in DAX or to create it via M code (code used by Power Query).
Approach 1: date table in DAX
The DAX code below allows you to dynamically create a date table in DAX. You will notice the use of the CALENDAR() function. This function is the backbone of our dynamic table. Using this function, Power BI creates a table between a start date and an end date. You have several options for specifying start and end dates. You can of course specify them manually (using the DATE() function) but we are moving away from the notion of a dynamic table since it will be fixed. You can also manually specify the start date and use the TODAY() function for the end date. In this way, the table will be dynamic since each new day, a line representing the new day will be added to the table. The other option is to use the MIN() and MAX() functions. For example, if your data model is composed of a single fact table that contains a column representing the transaction date, you can use the MIN() function on this column for the start date and the MAX() function on this column for the end date. This way, when a new transaction date appears in your fact table, it will also be added to the date table. In the code below, this is the approach we used. Note that the CALENDAR() function automatically creates a date table with a Date field. We can then create other columns that are derived from this column, for example a Year column, a Month column, etc. Finally, it is also possible to use the CALENDARAUTO() function which will create a date table starting from the smallest date in your data model until the largest date. Beware, this function will return the smallest and largest date based on all date columns in your data model. For example, if you have an employee dimension that contains the date of birth of your employees, you will have understood that the start date of your date table may go back several years if you have old enough employees.
Dim Date =
ADDCOLUMNS (
CALENDAR (MIN(TransactionDate), MAX(TransactionDate)),
"DateAsInteger", FORMAT ( [Date], "YYYYMMDD" ),
"Year", YEAR ( [Date] ),
"MonthNo", FORMAT ( [Date], "MM" ),
"YearMonthNo", FORMAT ( [Date], "YYYY/MM" ),
"YearMonth", FORMAT ( [Date], "mmm YYYY" ),
"MonthShort", FORMAT ( [Date], "mmm" ),
"MonthLong", FORMAT ( [Date], "mmmm" ),
"WeekNo", WEEKNUM ( [Date] ),
"WeekDayNo", WEEKDAY ( [Date] ),
"WeekDay", FORMAT ( [Date], "dddd" ),
"WeekDayShort", FORMAT ( [Date], "ddd" ),
"Quarter", "Q" & FORMAT ( [Date], "Q" ),
"YearQuarter",
FORMAT ( [Date], "YYYY" ) & "/Q"
& FORMAT ( [Date], "Q" )
)
Approach 2: date table in M
The M code below allows you to create a dynamic date table directly in Power Query. In the M code, we define 2 parameters, namely the StartDate and the EndDate. In this example, the StartDate is entered manually while the EndDate uses a function returning today’s date. The principle is the same as the table in DAX, Power Query will return a date table that starts on the date defined in the StartDate and ends on the date defined in the EndDate, i.e. the date of the active day. Finally, still as with the table in DAX, it is possible to derive columns from the Date column.
let
  Source = List.Dates(StartDate, #"Table Length", #duration(1, 0, 0, 0)),
  #"Converted to Table" = Table.FromList(Source, Splitter.SplitByNothing(), null, null, ExtraValues.Error),
  #"Renamed Columns" = Table.RenameColumns(#"Converted to Table", {{"Column1", "Date"}}),
  #"Changed Type" = Table.TransformColumnTypes(#"Renamed Columns", {{"Date", type date}}),
  StartDate = #date(2010, 1, 1),
  EndDate = DateTime.Date(DateTime.LocalNow()),
  #"Table Length" = Duration.Days(EndDate - StartDate)+1,
  #"Creat Date Table" = #"Changed Type",
  #"Inserted Year" = Table.AddColumn(#"Creat Date Table", "Year", each Date.Year([Date]), Int64.Type),
  #"Inserted Month" = Table.AddColumn(#"Inserted Year", "MonthNo", each Date.Month([Date]), Int64.Type),
  #"Inserted Month Name" = Table.AddColumn(#"Inserted Month", "MonthName", each Date.MonthName([Date]), type text),
    #"Inserted YearMonth" = Table.AddColumn(#"Inserted Month Name", "YearMonth", each Number.ToText([Year]) & "/" & [MonthName], type text),
    #"Inserted YearMonthNo" = Table.AddColumn(#"Inserted YearMonth", "YearMonthNo", each Number.ToText([Year]) & "/" & Number.ToText([MonthNo]), type text),
    #"Inserted YearMonthSort" = Table.AddColumn(#"Inserted YearMonthNo", "YearMonthSort", each [Year]*1000 + [MonthNo], Int64.Type),
  #"Inserted Quarter" = Table.AddColumn(#"Inserted YearMonthSort", "Quarter", each "Q" & Number.ToText(Date.QuarterOfYear([Date])), type text),
    #"Inserted YearQuarter" = Table.AddColumn(#"Inserted Quarter", "YearQuarter", each Number.ToText([Year]) & "/" & [Quarter], type text),
    #"Inserted Week" = Table.AddColumn(#"Inserted YearQuarter", "Week", each Date.WeekOfYear([Date]), Int64.Type),
    #"Inserted YearWeek" = Table.AddColumn(#"Inserted Week", "YearWeek", each Number.ToText([Year]) & "/" & Number.ToText([Week]), type text),
    #"Inserted YearWeekSort" = Table.AddColumn(#"Inserted YearWeek", "YearWeekSort", each [Year]*1000 + [Week], Int64.Type),
    #"Inserted Day of Month" = Table.AddColumn(#"Inserted YearWeekSort", "Day", each Date.Day([Date]), Int64.Type),
    #"Inserted Day of Week" = Table.AddColumn(#"Inserted Day of Month", "WeekDay", each Date.DayOfWeek([Date]), Int64.Type),
    #"Inserted Day Name" = Table.AddColumn(#"Inserted Day of Week", "DayName", each Date.DayOfWeekName([Date]), type text)
in
    #"Inserted Day Name"
Mark your table as a date table
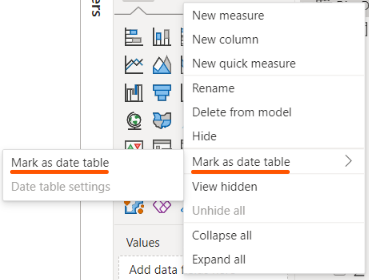
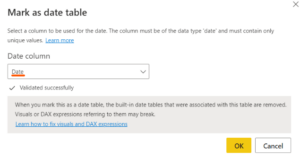
Once your date table is created (no matter which approach you choose), all you have to do is mark it as a date table in your data model. To do this, you just have to right click on your table in Power BI Desktop, select Mark as date table. A new window will open and you will need to specify which is your column containing the date.
Which approach to choose?
It’s all well and good, but what approach should I use you will say to me! I will answer you that there is no better approach but that in terms of performance, the M-table in Power Query is more efficient. Calculated tables and calculated columns in DAX in Power BI generally require more computation time than tables and columns created in Power Query. However, if I had a recommendation for you, I would recommend that you create a dynamic date table in a Dataflow (which uses M code). In this way, you can reuse the same table from one dataset to another. Isn’t that one of the objectives of BI, to centralize data to promote their use 🙂.
There you go, now you know how to create a dynamic date table in Power BI! I hope this little trick will allow you to optimize your Power BI data models and gain efficiency.