I had to do business with ventriloc on several major projects. They stand out for their understanding of business needs and their translation into technical requirements. The delivery plans are detailed and the deadlines respected. The quality of the deliverables is irreproachable.
Together, we unlock the true value of your data
We design innovative, data-driven solutions that empower responsible leaders to make informed decisions.
Trusted by 80+ partners
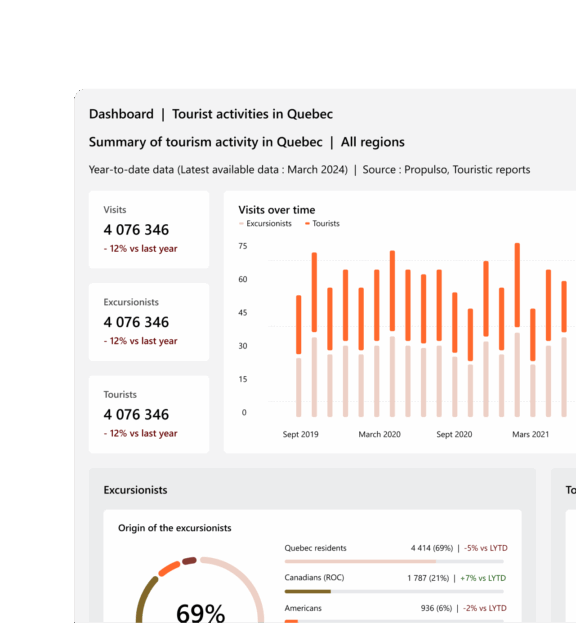
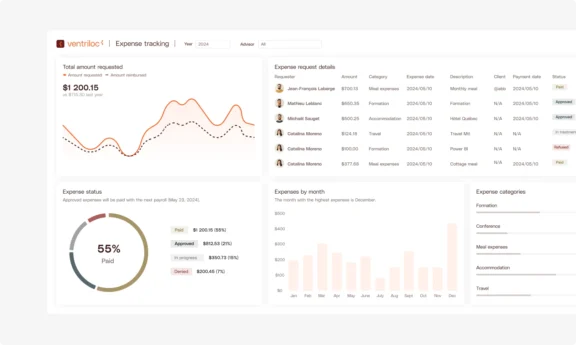
Designing Custom Analytical Interfaces
We create analytical reports and dashboards tailored to your users’ needs and aligned with your organization’s goals. Our team advises you on industry-leading visualization standards while maintaining the flexibility to adapt to your unique context.
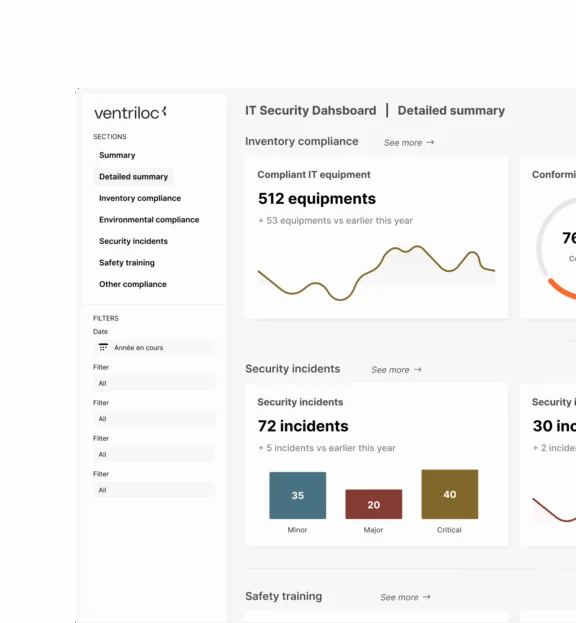
Implementation of a Power BI Design System
We develop Power BI Design Systems to establish a consistent standard for analytical reporting across your organization. A Power BI Design System provides governance over internally developed analytical content, enhancing the overall user experience.
Metrics and KPIs built on a solid data model that evolves over time
The interfaces we develop are built on a solid data model that ensures the solution’s long-term scalability. This model is designed based on your business processes and industry best practices.
Relying on this foundation, our experts develop KPIs and metrics tailored to your analytical context, providing a robust semantic layer that can be leveraged across multiple analysis scenarios.
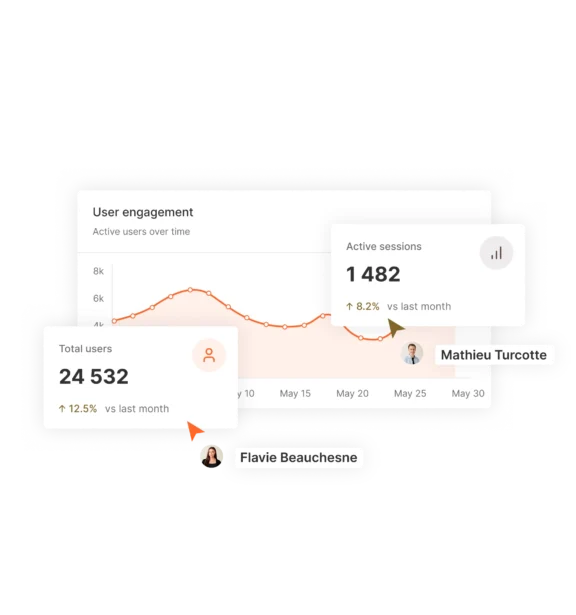
Data storytelling is in our DNA
The reports and dashboards we develop tell a story. Ventriloc integrates multiple methods into its development process to ensure effective data storytelling within interfaces. Incorporating data storytelling enhances user adoption and simplifies data interpretation by guiding users toward critical insights, ultimately improving decision-making.
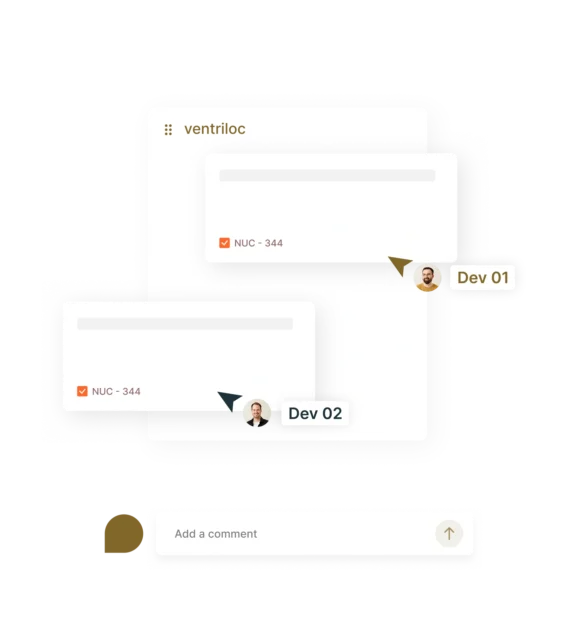
Developers who document for real. Yes, we exist.
All the solutions we implement are documented and enriched with metadata to help users quickly understand the business rules applied and the analytical context. Well-documented reports facilitate knowledge transfer, reach a broader audience, and improve data literacy within your organization.
Experts in data visualization that drives value.
From user requirements to report deployment, our experts guide you through every step. Ventriloc has developed a proven methodology for gathering and validating requirements that actively involves end users throughout the development of analytical interfaces. We assist users in articulating their needs through mockups and real-world demonstrations, ensuring transparency regarding feasibility. Once the requirements are defined, our experts prepare your data and build the data model and calculations necessary to meet analytical goals.
Our reports and dashboards are designed to deliver an exceptional user experience (UX) and intuitive interfaces (UI), while setting a new benchmark for visual standards to encourage strong adoption. After development, we assist with deployment and user adoption by integrating the solution into your decision-making processes, implementing security protocols, defining access strategies, and providing continued support.
Why are the analytical interfaces we develop adopted by users?
-
UX/UI is optimized in every interface we develop
Each interface we develop is carefully reviewed by our team of experts to ensure a flawless user experience (UX) powered by optimized user interface (UI) design. We are constantly seeking the best practices in visual ergonomics and interface usability, continuously pushing our standards higher.
-
We design interfaces that reveal the truth behind your data
Through the integration of robust data storytelling within the interfaces we design, our experts ensure that each visual element contributes to the overall narrative. They continuously push beyond the status quo, developing insightful indicators that communicate clearly and support effective decision-making.
-
We push the visualization tools we use beyond their standard capabilities
Our experts push the limits of Microsoft Power BI to meet user needs. Whether through the development of custom visuals or out-of-the-box ideas, we adapt to user requirements thanks to our advanced knowledge of the tools we use.
The best compliment we’ve ever received about a report developed by one of our experts: “That can’t be Power BI — it’s impossible to do that!” True story.
-
End-user involvement
In every stage of our analytical interface development process, the end user remains at the core of our approach. Our experts work hand in hand with users to design solutions that align with their needs and objectives. Beyond their technical skills, our experts possess solid business acumen, allowing them to effectively support users in analytical reflection and insight generation.
Beyond visualization, towards insight
-
Platform best practice recommendations
-
Power BI licensing guidance
-
Report sharing strategy implementation
-
Governance processes and certification of reports and datasets
-
Power BI report optimization and support
-
Organizational development process implementation
-
Experts in DAX and Power Query (M), the core languages powering Power BI
-
Power BI Desktop and Service training
-
Designing and developing tailored data visuals
-
Power BI portal administration
Your data speaks. Ours does too.
-

Over 1,000,000
views on the reports we’ve created.
-

More than 10,000
unique users have engaged with the reports we developed in the past year.
-
600+
user interfaces designed and developed.
Together, we turn
your data into value.
FAQs
95% of the projects we carry out are developed using Microsoft Power BI. However, we also have strong expertise in the development of personalized mapping using libraries available in several programming languages (Python, R). In addition, our experts are very familiar with all the other tools on the market such as Tableau, QlikView, Grafana, SAP BusinessObjects, Cognos, Google Data Studio and Looker.
Yes! All our experts are certified or in the process of obtaining certification in PL-300 – Microsoft Power BI Data Analyst (Exam PL-300: Microsoft Power BI Data Analyst). Fun fact, each employee gets a salary bonus when they obtain Microsoft certifications.
Absolutely! We develop custom visuals for our partners, whether in Deneb, SVG, or fully custom visuals. However, we always strive to use the default visuals or Microsoft-certified custom visuals whenever possible to ensure optimal stability in the reports we build.
Just like the legend around the origin of poutine, there are some who would say it comes from Victo and others from Drummond, but we will never know for sure which one. In our case, it’s kind of the same thing! We started with the Design system concept, which is well known in the field of marketing, and we adapted it for Power BI in 2018, and that’s when we had the genius idea to call it “Power BI Design system”. Let’s just say that we were among the first to have implemented the concept, so as not to cause an argument! 🙂